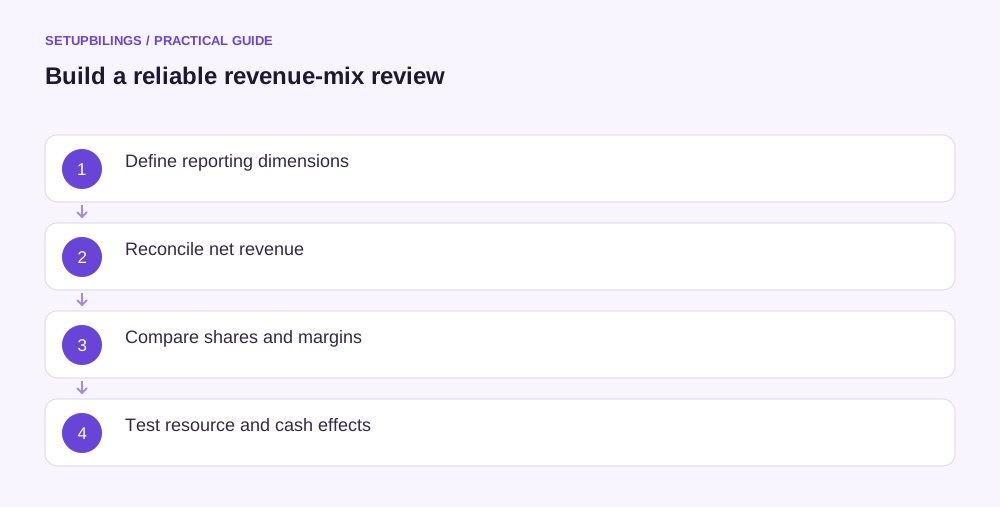
Compare revenue by product, service and customer segment using separate, consistently defined dimensions of the same sales records. Calculate each group’s rupee revenue, share of total revenue and change over time. Then add gross profit, collections or another relevant measure so that growth in a segment is not mistaken for better overall economics.
A product is what you sell, a service is an activity you provide and a customer segment describes whom you serve. These dimensions can overlap. The same invoice may belong to an equipment category and an institutional-customer segment; adding those two totals together would count the sale twice.
Define the questions and classification rules
Start with the decisions the report should support. Product analysis might guide range selection. Service analysis might reveal installation or maintenance demand. Customer analysis might compare retailers, contractors and direct consumers.
Create a short data dictionary. Define each category, its owner and how new items or customers are assigned. Use stable codes rather than free-text labels that vary across invoices. Keep an “unclassified” exception list and resolve it instead of silently excluding those sales.
For mixed invoices, classify individual lines where the data supports it. If a bundled price covers equipment and service, use a defensible documented allocation for management analysis and reconcile it to recognised revenue. Formal accounting treatment must follow the applicable revenue framework and transaction facts.
Use net recognised revenue consistently
Begin with revenue reconciled to the profit and loss statement. Apply consistent treatment to returns, rebates, discounts and amounts collected on behalf of authorities. A collection report and a revenue report answer different questions and need not have the same totals.
ICAI AS 9 addresses revenue recognition under the AS framework, while entities applying Ind AS follow their relevant requirements. A deposit, draft quotation or unsigned order should not be added to recognised revenue merely to make a segment appear larger.
Link credit notes to the original product and customer wherever possible. Otherwise, a return can sit in an unallocated row while the affected segment retains overstated revenue. Preserve a separate reconciliation for adjustments relating to older periods.
Build the first mix table
An illustrative Pune commercial-kitchen supplier earns ₹100 lakh net revenue: ₹60 lakh equipment, ₹25 lakh installation and ₹15 lakh maintenance. The mix is 60%, 25% and 15% respectively.
| Revenue category | Previous year | Current year | Current share |
|---|---|---|---|
| Equipment | ₹50 lakh | ₹60 lakh | 60% |
| Installation | ₹15 lakh | ₹25 lakh | 25% |
| Maintenance | ₹15 lakh | ₹15 lakh | 15% |
| Total | ₹80 lakh | ₹100 lakh | 100% |
Total revenue grew 25%, but maintenance did not grow. Installation supplied ₹10 lakh of the ₹20 lakh increase. That is a specific mix observation; it does not yet establish whether the new installation work was profitable or collected promptly.
Calculate share change in percentage points. Maintenance fell from 18.75% of revenue to 15%, a decline of 3.75 points, despite unchanged rupee sales. Both facts matter when judging recurring-service demand.
Add economics to the revenue shares
Suppose equipment has a 20% gross margin, installation 35% and maintenance 50%, using consistent direct-cost definitions. Current gross profit is ₹12 lakh + ₹8.75 lakh + ₹7.5 lakh = ₹28.25 lakh. Weighted gross margin is 28.25%.
Do not average the three percentages directly; their simple average of 35% ignores unequal revenue weights. The correct total comes from adding rupee gross profit and dividing by total revenue.
A shift toward installation may improve the headline margin, yet require more technicians, travel and working capital. Add service hours, customer acceptance delays and direct cash costs before deciding which category should receive more investment.
Create a second view by customer segment
The same ₹100 lakh might comprise ₹45 lakh restaurant chains, ₹35 lakh independent hotels and ₹20 lakh institutional kitchens. This customer view must total ₹100 lakh independently; it is not added to the product view.
A cross-tab can show product categories down the rows and customer segments across columns. It helps identify, for example, whether installation growth came mainly from chains while maintenance remains concentrated in independent hotels.
Keep customer groups commercially meaningful and mutually exclusive within that dimension. A buyer should not appear as both a chain and an independent hotel unless a documented transaction-level rule supports that split. Review customers that change group so comparisons remain understandable.
Check distortions and practical limits
Price rises, acquisitions, branch openings and changes in category coding can create apparent mix shifts. Separate quantity growth from realised-price changes where possible. A discontinued low-value item can reduce invoice counts while increasing average revenue per order.
Compare equivalent periods and seasonality. A project-heavy quarter may not represent the annual service mix. Also inspect customer concentration and receivable ageing: strong segment revenue can create funding pressure when a few buyers pay slowly.
ICAI AS 17 provides a formal segment-reporting framework where applicable, but an internal mix report is not automatically a statutory segment disclosure. Use management categories suited to the decision while keeping them reconciled to the accounts.
Retain an audit trail for category changes. If a customer moves from one segment to another, show whether comparative figures were regrouped for analysis. That prevents a coding decision from appearing as new demand.
End with decisions supported by the mix
For the kitchen supplier, investigate installation capacity, maintenance renewal opportunities and category collection patterns. Set actions based on margin and resource use rather than revenue share alone.
Maintain the classification map and repeat the report consistently. A good revenue-mix review shows where growth originates, how it changes the earnings model and which operational evidence is needed before shifting sales effort or capital.