Forecast sales by combining accepted orders, expected repeat purchases and probable new business, then adjusting timing for seasonality, delivery capacity and known customer changes. Keep these demand sources separate so the same customer order is not counted twice. Estimate quantities and realised prices before calculating revenue.
Historical growth is useful evidence, but it should not replace an explanation of where next month's sales will come from. A practical forecast shows which part is already committed, which part depends on normal buying behaviour and which part remains uncertain.
Start with a clean historical view
Consider an illustrative Mysuru packaging distributor forecasting one quarter. It groups customers by buying pattern and products by meaningful family. It removes cancelled invoices, reflects returns consistently and identifies unusually large one-off orders.
Compare like periods. A month with more working days or a festival-related shutdown may differ from the previous month for reasons unrelated to underlying demand. Record price changes separately from volume changes so that revenue growth does not conceal fewer units sold.
ICAI's budget material treats the sales forecast as a starting point for linked operating budgets. That makes forecast quality important beyond the sales team: purchasing, staffing and cash plans will rely on its timing and product mix.
Divide demand into nonoverlapping sources
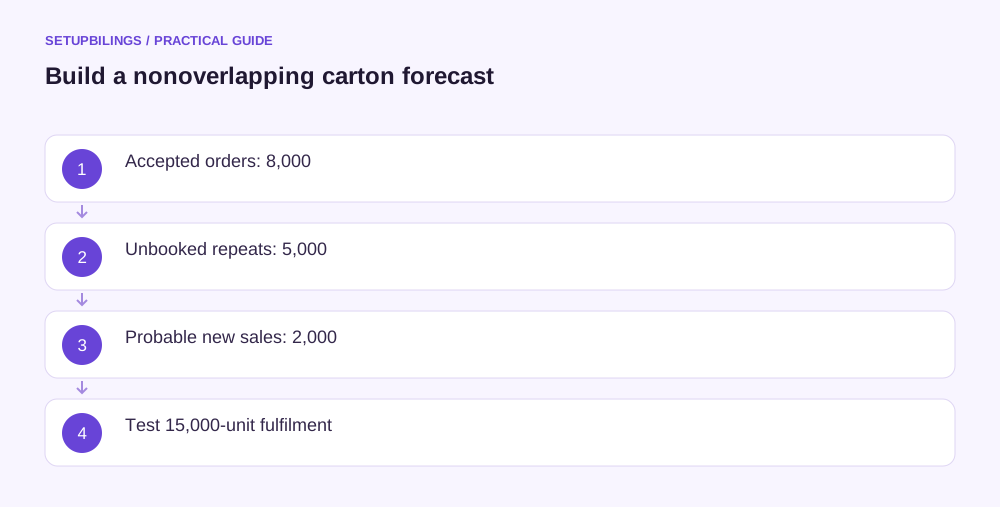
The distributor builds the following illustrative base forecast for cartons:
| Demand source | Quantity | Evidence |
|---|---|---|
| Accepted orders due this quarter | 8,000 | Customer purchase orders and delivery dates |
| Expected repeat purchases not yet ordered | 5,000 | Customer-level buying cycles |
| Probable new business | 2,000 | Qualified opportunities and conversion evidence |
| Total forecast | 15,000 | Reconciled customer and product schedule |
At an average net realised price of ₹40, expected revenue is ₹6,00,000. If accepted orders include a repeat customer's usual monthly requirement, remove that quantity from the unbooked repeat estimate. “Order book plus last year's sales” is likely to double count demand.
Accepted orders also need review. Confirm whether customers can cancel, whether specifications are final and whether delivery dates are realistic. A purchase order with unresolved approval is not equivalent to a ready-to-dispatch order.
Forecast repeat purchases at customer level
Use purchase frequency, typical quantity, last purchase date and known stock or operating changes. If a customer usually orders 500 cartons every six weeks, an expected order date should follow that cycle rather than a flat monthly average.
Check whether the customer has changed production, opened another outlet or moved business to a competitor. A historical repeat pattern is a starting assumption, not a guarantee. Where evidence is limited, show a range rather than a precise order date.
Separate large customers whose behaviour materially affects the forecast. Smaller customers can be grouped where their aggregate pattern is stable. This keeps the model manageable without hiding concentration risk inside an average.
Apply seasonality without counting it twice
Suppose the distributor's unadjusted repeat estimate is 4,000 cartons, and comparable records support a 25% uplift for a specific peak period. The adjusted repeat estimate is 5,000. Do not apply another 25% uplift to the entire 15,000-carton forecast if accepted orders already reflect the peak.
Seasonal patterns should be based on comparable business conditions. A prior year's unusually strong festival promotion, temporary stock shortage or large institutional order can distort an index. Explain those events before carrying the pattern forward.
Check changes in festival dates, customer production calendars and working days for the actual forecast period. Use verified current calendars where timing matters instead of assuming every peak falls in the same month each year.
Estimate new business from conversion evidence
For qualified opportunities, record expected order size, likely close date and the stage reached. Probability weighting can help build an aggregate forecast where historical conversion supports the percentages. It does not mean a ₹1,00,000 opportunity at 40% probability will produce a ₹40,000 order.
Avoid adding a sales target as a separate demand source after counting the pipeline. A target states what the team wants to achieve; the forecast states what current evidence supports. Show the gap explicitly and describe the activity needed to close it.
Review sales timing as well as ultimate conversion. A won order delivered next quarter cannot fund this quarter's production or revenue expectation.
Reconcile demand with the ability to deliver
Compare the forecast with stock availability, supplier lead times, production capacity and dispatch constraints. If only 13,000 cartons can be supplied, a 15,000 forecast needs an explicit procurement or capacity action. Do not quietly assume unlimited fulfilment.
Use product and channel mix to estimate contribution and cash collection. The same revenue can generate different margins and payment dates. The sales forecast should feed those schedules rather than being copied directly into bank receipts.
Keep units and price assumptions auditable
Where several carton sizes are grouped, retain the underlying mix or representative basket. An average price can change simply because customers buy different sizes. Check whether the same mix also changes stock cost, storage volume and delivery requirements before treating the revenue movement as a pure price change.
Learn from forecast misses
After the quarter, explain differences through lost orders, delayed orders, repeat behaviour, new-business conversion, price and returns. Evaluate the forecast version that existed before the period began so the comparison remains meaningful.
Update the assumptions where errors recur. If repeat customers consistently order later than expected, revise the cycle. If enquiries rarely convert, change the pipeline evidence standard. A useful forecast becomes more dependable because each miss improves the next estimate, while the owner can still see which sales are committed and which require action.